How to Analyze A/B Test Results in Hotjar with Optimal UX Integration
 Feb 7, 2025
Introduction
Combine the power of Hotjar’s behavioral analytics with your A/B testing data from Optimal UX. This integration enables you to analyze user behavior recordings, heatmaps, and other visual insights specifically for different experiment variants, helping you understand not just what users do, but how they interact with your variants.
Why Use Hotjar for A/B Test Analysis?
- Watch real user sessions for specific experiment variants
- Create heatmaps segmented by experiment participation
- Understand user behavior through visual analytics
- Combine quantitative and qualitative insights
- Get direct visual feedback on variant performance
Step-by-Step Integration Guide
Enable the Integration
- Log into your Optimal UX dashboard
- Navigate to Settings > Integrations
- Locate the Hotjar integration card
- Toggle the integration switch
Understanding Data Flow
When enabled, Optimal UX automatically sends experiment participation data to Hotjar as custom events:
- Events are triggered using the Hotjar JavaScript API
- Event names follow the format:
viewed_optux_[experiment slug]_[variant name] - Example: For an experiment with slug “xyz123” and variant “Variant B”, the event would be
viewed_optux_xyz123_variant_b
Security Note: Optimal UX uses experiment slugs instead of full experiment names to ensure data security.
Using Experiment Data in Hotjar
Creating Segments
- Open your Hotjar dashboard
- Navigate to Recordings
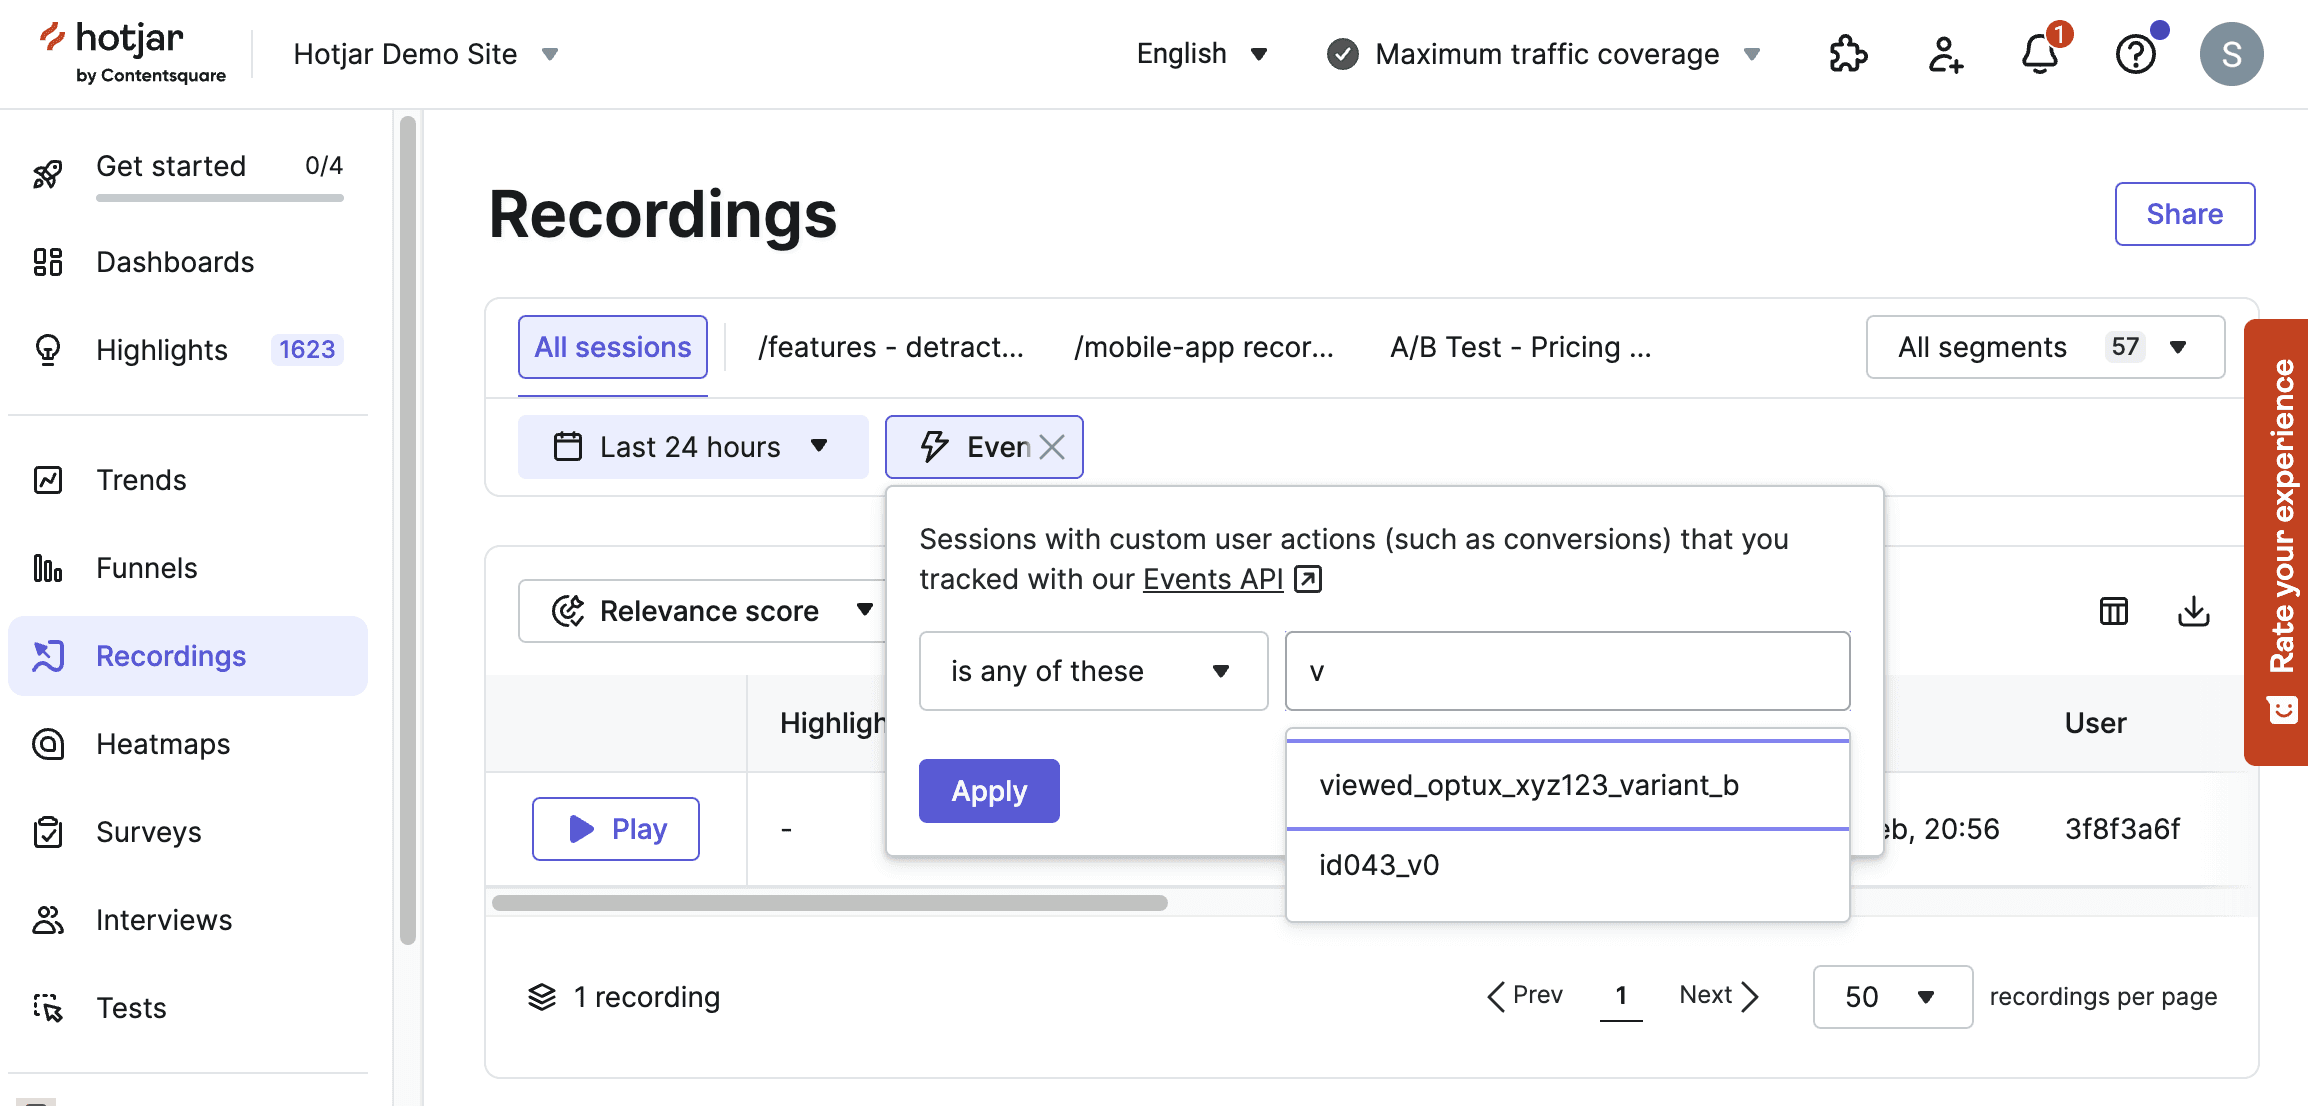
- Use the “Event” filter
- Find an event that starts with “viewed_optux_”
- Select your experiment event
- Click “Save Segment”
Analysis Capabilities
- View recordings filtered by experiment variant
- Create variant-specific heatmaps
- Compare user behavior across variants
- Analyze form analytics per variant
- Track rage clicks and user frustration by variant
Viewing Experiment Data
Recordings
- Go to Recordings in Hotjar
- Apply your experiment segment filter
- Watch sessions from specific variant groups of your A/B test
Heatmaps
- Create a new heatmap
- Select your A/B test segment
- Collect data for variant-specific interactions
Common Use Cases
- Compare click patterns between variants
- Identify user confusion points
- Analyze scroll depth differences
- Monitor form abandonment by variant
- Track user paths through new features
Conclusion
The integration between Optimal UX and Hotjar bridges the gap between A/B testing and behavioral analytics. By combining these tools, you can understand not just which variants perform better, but why they perform better through direct user behavior observation.