How to Analyze A/B Test Results in Mixpanel with Optimal UX Integration
 Jan 31, 2025
Introduction
Supercharge your A/B testing analysis by connecting Optimal UX with Mixpanel’s powerful event analytics platform. This integration enables product teams to analyze experiment results alongside user behavior data, creating a comprehensive view of how variants affect your product metrics.
Why Use Mixpanel for A/B Test Analysis?
- Track experiment participation in real-time
- Create sophisticated user cohorts based on variants
- Build custom funnels to analyze variant performance
- Leverage Mixpanel’s powerful query engine
- Combine experiment data with user behavior metrics
Step-by-Step Integration Guide
Enable the Integration
- Log into your Optimal UX dashboard
- Navigate to Settings > Integrations
- Find the Mixpanel integration card
- Toggle the integration switch
Understanding Data Flow
When enabled, Optimal UX automatically sends experiment participation data to Mixpanel:
- Events are tracked using Mixpanel’s JavaScript SDK
- The integration uses the
$experiment_startedevent - Event properties include: javascriptCopymixpanel.track(“$experiment_started”, { “Experiment name”: “[experiment_slug]
Security Note: Optimal UX uses experiment slugs instead of full experiment names to ensure data security.
Using Experiment Data in Mixpanel
Accessing Experiment Data
- Open your Mixpanel project
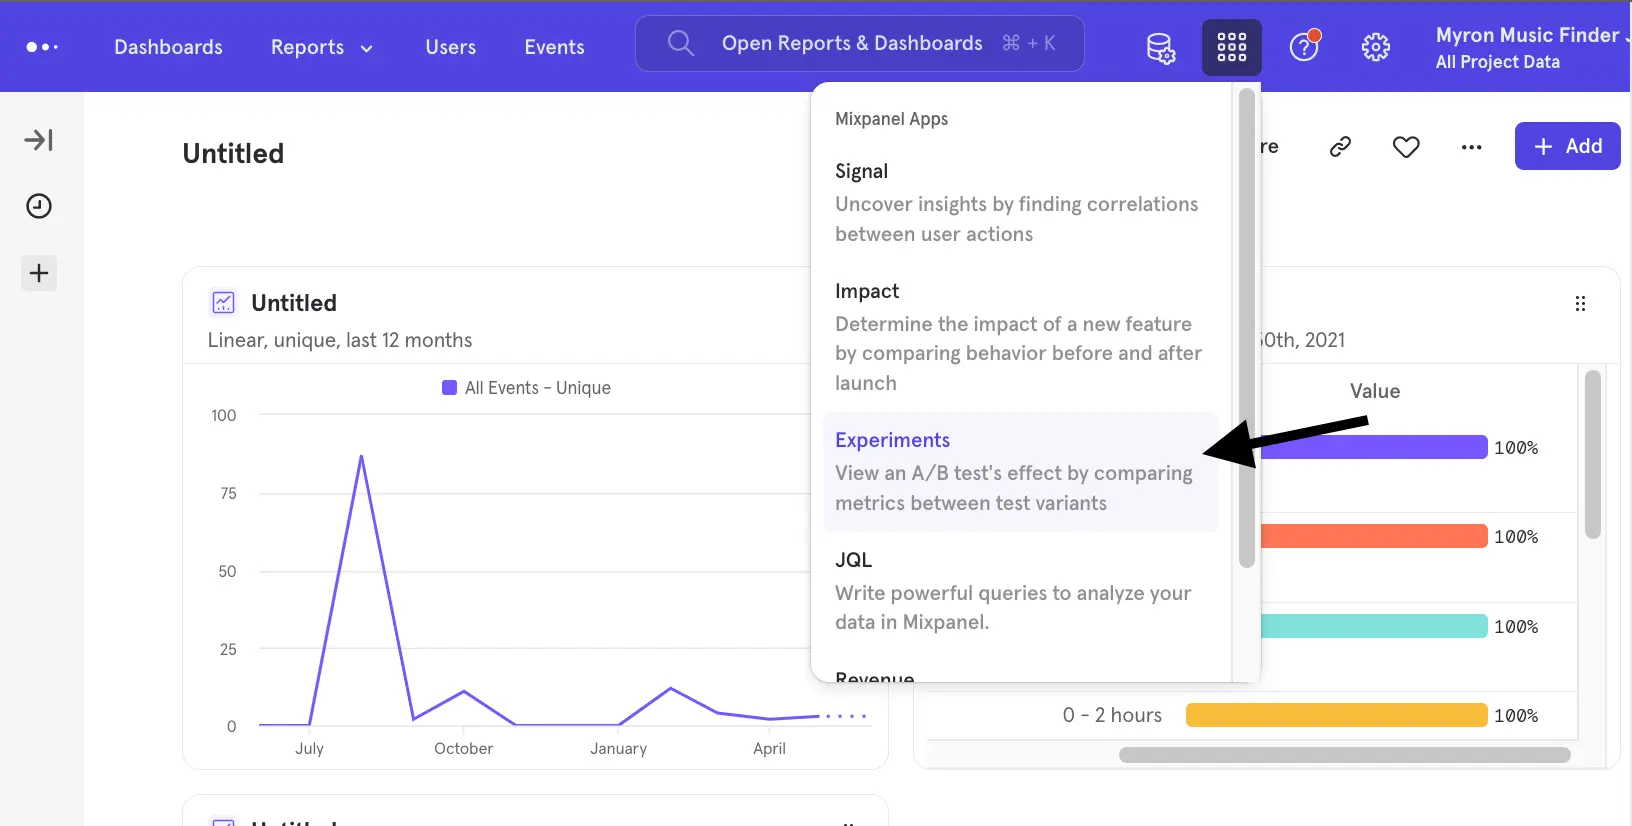
- Navigate to Experiments under Application
- Select an experiment
- View experiment properties
Analysis Capabilities
- Calculate control and variant group rates (using totals or unique counts) and determine the lift or delta to understand conversion differences.
- Analyze funnel conversion rates (based on unique counts) for each variant to evaluate performance through different steps.
- Leverage custom dashboard reports and metric segmentation to compare long-term user behavior—including retention—across control and variant groups.
- Prepare tailored boards by combining various report types (Insights, Funnels, etc.) and applying breakdowns to focus on metrics that matter to your experiments.
- Automatically detect and monitor experiments (via events like
$experiment_started) to observe variant-specific user journeys and confidence trends over time.
Building Reports
- A/B Test Impact Report: Compare conversion rates between control and variant groups using key metrics like totals or uniques.
- Funnel Conversion Report: Analyze variant-specific funnel performance by tracking unique event counts through each step.
- Segmented Breakdown Report: Drill down into metrics by applying property-based segmentation to compare variant performance.
- Confidence Trend Report: Visualize how the statistical significance (confidence score) of your A/B test results evolves over time.
- Custom Dashboard Report: Combine insights from multiple reports (Insights, Funnels, etc.) into one unified, customizable view.
Conclusion
The integration between Optimal UX and Mixpanel provides sophisticated analytics capabilities for A/B testing analysis. By leveraging Mixpanel’s advanced features, teams can gain deep insights into how different variants affect user behavior and make data-driven decisions with confidence.